XLM BTC Analysis
Last week, we saw an upward move in BTC price breaking the $3,500 resistance levels to give a new yearly high at $3,710. A break just above the 50% Fib retracement level from the previous wave low at $3,350.
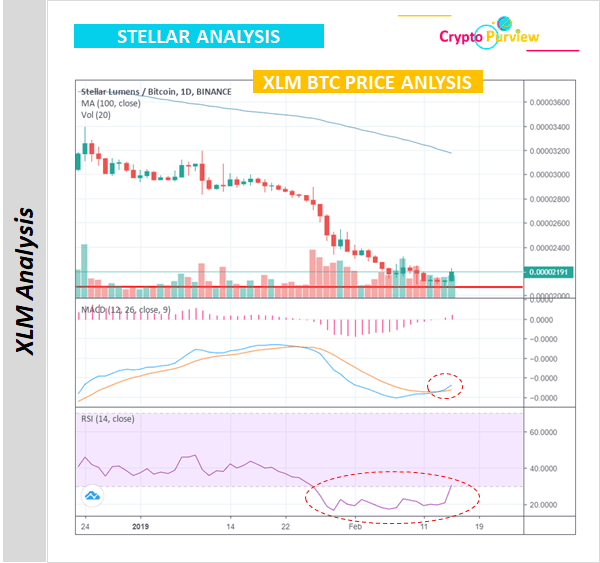
Majority of the cryptocurrencies experienced a double-digit gain, however, Stellar remained shy and continued downward momentum to new lows near 0.00002070 BTC per XLM.
At the moment trading at 0.00002185 BTC per XLM, it shows some momentum. Currently, the XLM BTC pair has strong support at 0.00002070 BTC.
To continue the upward momentum, XLM BTC pair has to break the next resistance level at 0.00002245 BTC. As long as the pair is traded above the 0.00002150 BTC support levels, bulls remain in action.
By looking at technical indicators,
- Daily MACD seems to move to bull zone, a confirmed MACD crosses above its signal line.
- RSI waited too long under 30. Oversold in the past few days, now shows sign of recovery in daily RSI charts.
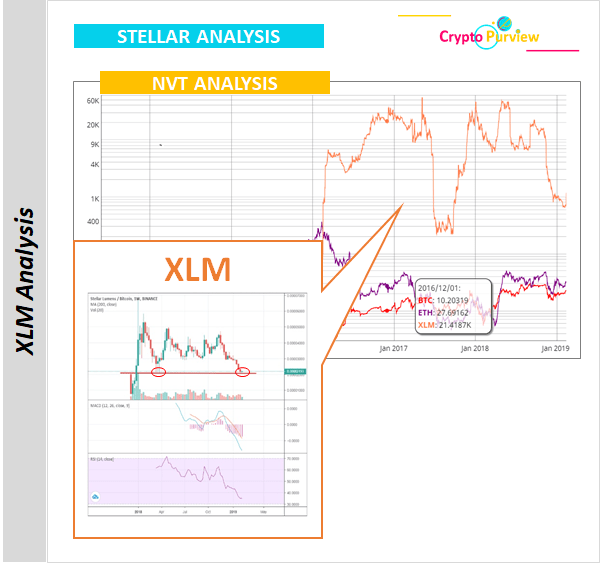
As per the Network value to the transaction,
XLM is overvalued in comparison to its peer’s Bitcoin and ETH. On the long-term technical analysis charts, there are no confirmed signs of big recovery. Current RSI levels continue its downward path to oversold levels.
If a downside correction continues, the price could test the next support level at 0.00001985 BTC per XLM.
Stellar recent news
- ‘
Coinsquare ‘, the biggest crypto exchange in Canada, has acquired StellarX. The reason for this acquisition was the dollar-equivalent volume in StellarX, which gain a top-3 decentralized marketplace just weeks after launch.
Join here to discuss or comment about the post.