BTC Trading: What is Fibonacci retracement and How to use it

Fibonacci retracement levels indicate where the price might find support or resistance. They are based on Fibonacci numbers and each level associates a percentage. Traders attempt to use them to determine critical points where an asset’s price momentum is likely to reverse.
What Fibonacci Retracement Levels Tell You?
Fibonacci retracements can be used to place entry orders, set price targets, or place stop-loss orders. When an asset is trending very strongly in one direction, the belief is that the pullback will amount to one of the percentages included within the Fibonacci retracement levels: 23.6%, 38.2%, 61.8%, or 76.4%.
For example, if an asset jumps from $10 to $11, the pullback is likely to be by approx. 23 cents, 38 cents, 50 cents, 62 cents, or 76 cents. If the price retraces 100% of the last price wave, that may mean the rally has failed.
How To Draw Fibonacci Retracement Levels
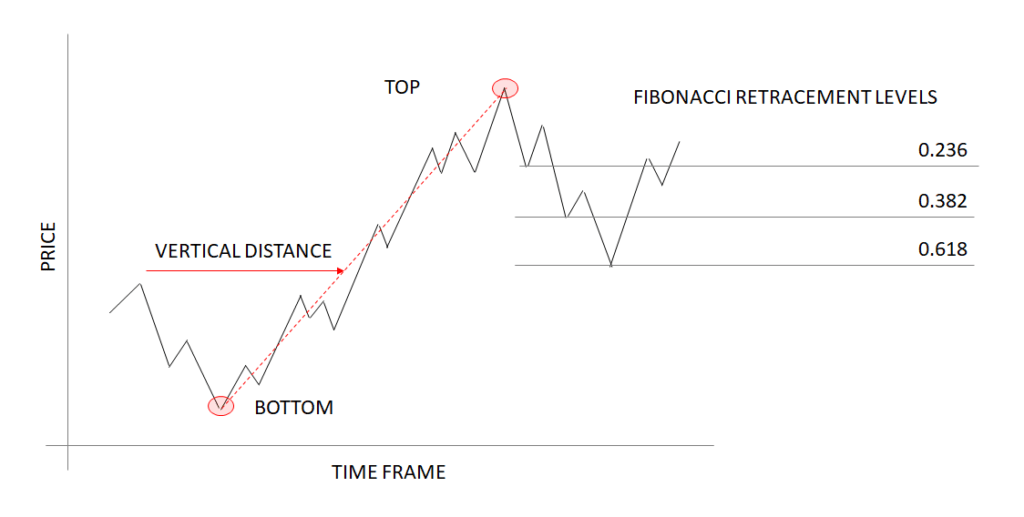
To create Fibonacci retracement levels, a trader needs to find two extreme points (top and a bottom) on the crypto asset such as the Bitcoin chart and dividing the vertical distance by the key Fibonacci ratios such as 23.6%, 38.2%, and 61.8%. The most commonly used of the three levels is 0.618. While not officially a Fibonacci ratio – 50% is also used, though the 50% retracement level is not really a Fibonacci ratio. Once these levels are identified, horizontal lines are drawn to identify possible support and resistance levels.
In an uptrend:
- Identify the direction of the market: uptrend.
- Find two extreme points (bottom and top) on the crypto asset price chart.
- Attach the Fibonacci retracement tool on the bottom and drag it to the right, all the way to the top.
- Monitor the three potential support levels: 0.236, 0.382, and 0.618.
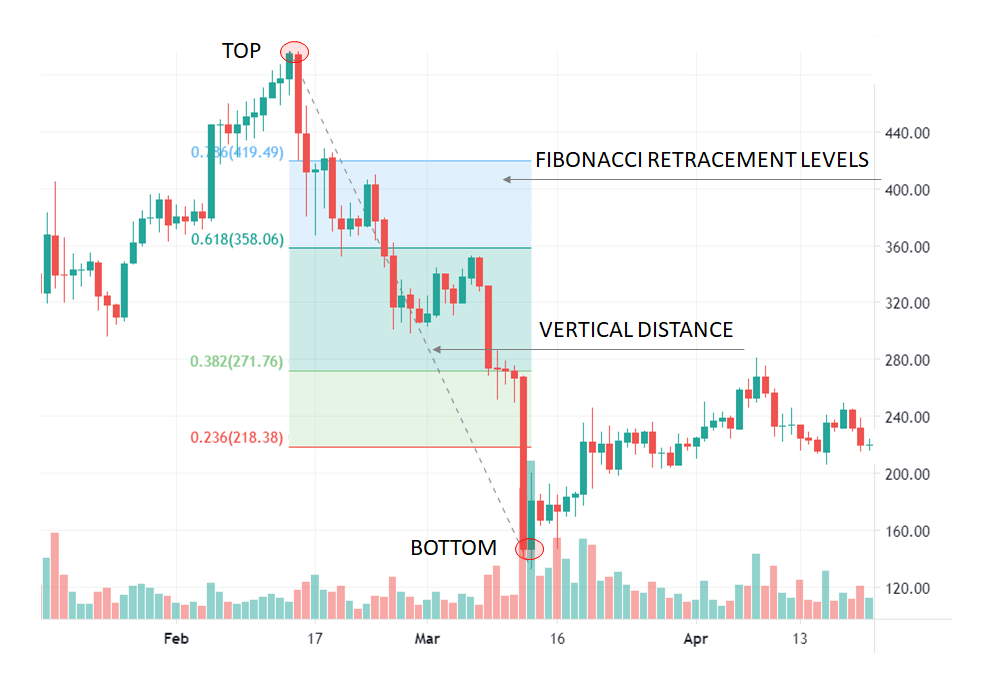
In a downtrend:
- Identify the direction of the market: downtrend.
- Find two extreme points (top and bottom) on the crypto asset price chart.
- Attach the Fibonacci retracement tool on the top and drag it to the right, all the way to the bottom.
- Monitor the three potential resistance levels: 0.618, 0.382, and 0.236.
Important:
- Fibonacci levels provide an estimated entry area but not an exact entry point. There is no guarantee the price will stop and reverse at a particular Fibonacci level, or at any of them.
- Many traders enter the market just because the price has reached one of the Fibonacci ratios on the chart. It is better to use in conjunction with other indicators such as Moving Average or stochastic oscillators before placing orders.
- If the price retraces 100% of the last price wave, that may mean the trend has failed.
- If you use the Fibonacci retracement tool on very small price moves, it may not provide accurate insight.