How to read RSI (Relative Strength Index)
The Relative Strength Index (RSI), developed by J. Welles Wilder, is a momentum oscillator that measures the speed and change in the price movements to evaluate assets overvalued or undervalued conditions.
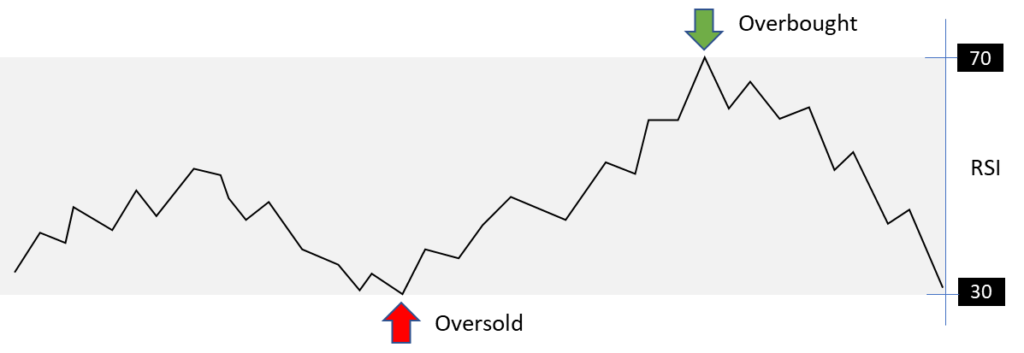
How to read RSI: The RSI is displayed as a line chart that oscillates between 0 and 100 scale. Traditionally the RSI is considered overbought when above 70 and oversold when below 30.
These traditional levels can also be adjusted if necessary to better fit the asset or market dynamics.
For example, if an asset (or a security) is repeatedly reaching the overbought level of 70 (often observed during string trends) you may want to adjust this level to 80.
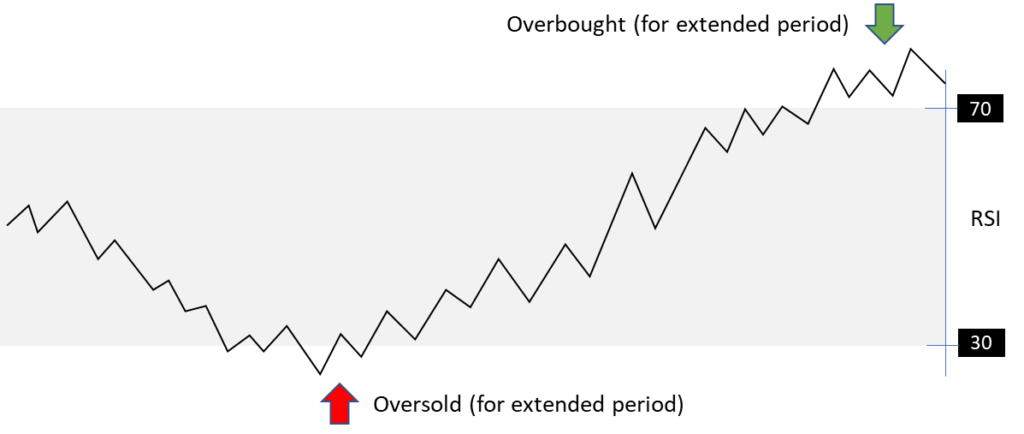
Note: During strong trends, the RSI may remain overbought or oversold for extended periods.
The RSI can do more than point to overbought and oversold:
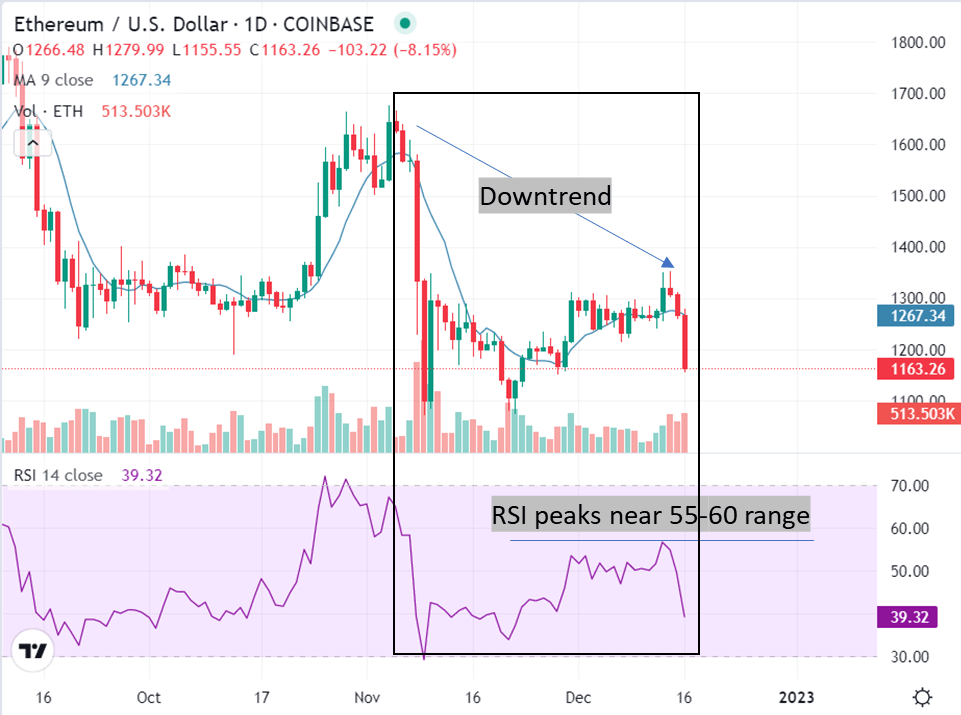
Traders look for support or resistance using the RSI chart. In an uptrend, RSI tends to remain in the 40 to 90 range with the 40-50 zone acting as support. During a downtrend, RSI tends to stay between the 10 to 60 range with the 50-60 zone acting as resistance. These ranges will vary depending on the RSI settings and the strength of the asset (or security) or markets underlying trend.
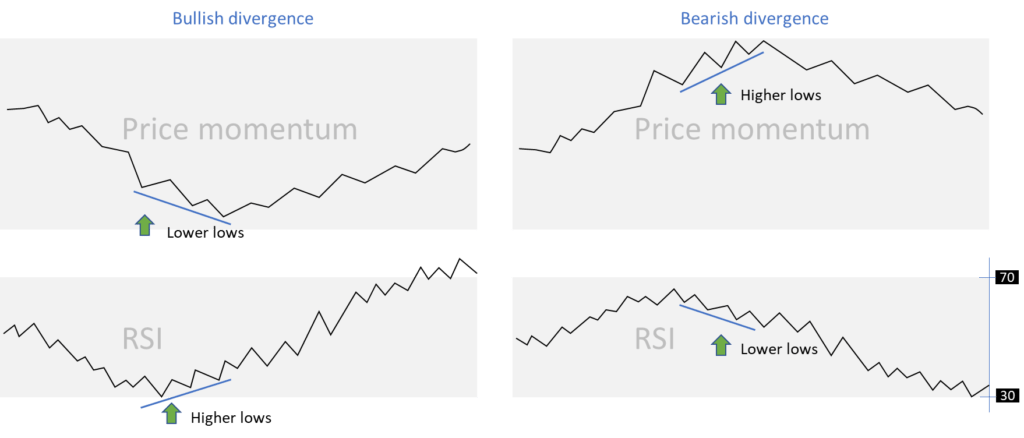
Other than indicating support or resistance levels, RSI also forms chart patterns that may suggest price reversals. A price reversal is identified when price moves in the opposite direction of the RSI. As you can see in the below chart, a bullish divergence occurs when the RSI forms higher lows in the presence of lower lows formed by the price. Similarly a bearish divergence occurs when observe formation of higher lows by the price in the presence of lower lows formed by the RSI.
PS: for swing failures: If the RSI makes a lower high and then follows with a downside move below a previous low, a Top Swing Failure has occurred. If the RSI makes a higher low and then follows with an upside move above a previous high, a Bottom Swing Failure has occurred.