BTC Trading: Understanding Triangle Chart Patterns
When a trader looks at the BTC price chart or any other crypto asset, it may appear to be completely random movements. This is often true, yet, within those price movements are patterns. Chart patterns are geometric shapes found in the price data that can help a trader understand the price action, as well as make predictions about where the price is likely to go. A triangle pattern is one such shape that indicates a BTC price trend.
They show a decrease in volatility that could eventually expand again. Triangles provide analytical insights into current conditions and give indicators of types of conditions that may be forthcoming. A triangle-like shape pattern on the BTC chart can indicate either a continuation or a reversal pattern.
Type of Triangles
A triangle pattern is formed when at least two swing highs and two swings lows in price converge, eventually reaching the apex of the triangle on the right side, forming a corner. The closer the BTC price gets to the apex of the triangle, the tighter and tighter price action becomes, thus making a breakout more immanent. There are three forms of triangle patterns, namely ascending, descending, and symmetrical triangles.
Ascending Triangle:
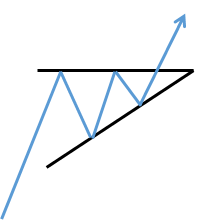
An ascending triangle is a bullish signal when price breakouts from the upper trendline. In this form of the triangle pattern, the upper trendline is horizontal, indicating near-identical highs. This forms a resistance level. The lower trendline is rising diagonally, indicating higher lows as buyers patiently step up their bids. Eventually, the buyers lose patience and rush into pushing the BTC price above the resistance price. The upper trendline, which was formerly a resistance level, now becomes support.
Descending Triangle:
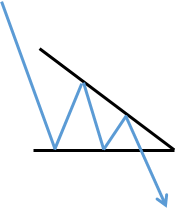
A descending triangle is an inverted version of the ascending triangle, wherein the lower trendline is horizontal, connecting near-identical lows, and the upper trendline declines diagonally toward the apex.
The breakdown occurs when the price collapses through the lower horizontal trendline support as a downtrend resumes. The lower trendline, which was support, now becomes resistance.
Symmetrical Triangle:
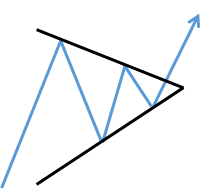
The symmetrical triangle is composed of a diagonal falling upper trendline and a diagonally rising lower trendline. As the price moves toward the apex, it will inevitably breach the upper trendline for a breakout or breach the lower trendline forming a breakdown and price downtrend.
Symmetrical triangles mostly tend to break in the direction of the initial move before the triangle formed. For example, if an uptrend precedes a symmetrical triangle, traders would expect the price to break to the upside.
Important:
An initial breakout is typically followed by some level of pullback. As the price retraces to the original breakout level or somewhat further, the trader should determine if the pullback is the false signal or the price will soon continue in the direction of the breakout.
To confirm the trend, traders should watch for a volume spike to confirm the break is valid and not a fake signal. The fake signal occurs most frequently at key breakout points, such as major support or resistance levels. A fake signal happens when the BTC price makes a move in one direction, but then reverses course and moves in the opposite direction. The fake signals can lead to significant losses as they often occur before the start of a major trend in the opposite direction.
Unfortunately, simply because the pattern is there, does not mean it is always reliable. Therefore, recommend adherence to strict stop-loss limits to minimize large risk exposure or losses.