BTC Trading: Understanding Double Top and Bottom
No chart pattern is more common in trading than the double bottom or double top. Double top and bottom patterns in the chart occur when the underlying crypto asset – Bitcoin price moves in a similar pattern to the letter “W” (double bottom) or “M” (double top).
- A double top has an ‘M’ shape and indicates a bearish reversal in trend, and
- The double bottom has a ‘W’ shape and is a signal for a bullish price movement.
Double Top Pattern
A double top is a reversal pattern that is formed after there is an extended move up. The “tops” are peaks that are formed when the price hits a certain level that can’t be broken. After hitting this level, the price will come down slightly but then return back to test the level again. If the price is rejected again from that level, then you have a double top.
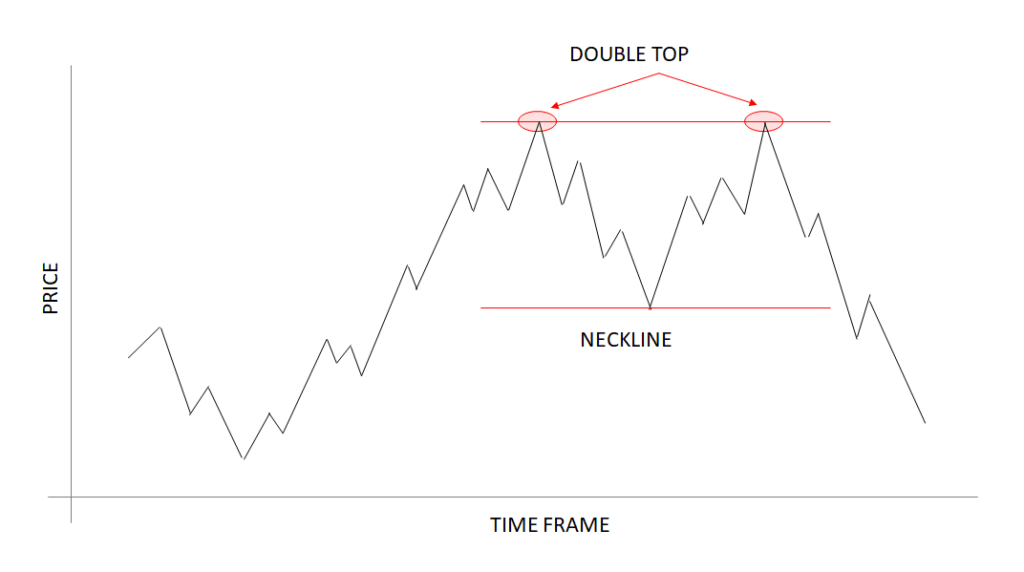
In the chart notice how the second top was not able to break the high of the first top. This is a strong sign that a reversal is going to occur because it is telling us that the buying pressure is just about finished.
Remember that double tops are a trend reversal formation so you’ll want to look for these after there is a strong uptrend. Once the double top is formed, traders place their entry order below the neckline because we are anticipating a reversal of the uptrend.
Double Bottom Pattern
Double bottom patterns are the opposite of double top patterns. Results from this pattern have the opposite inferences. This time we are looking to go long instead of short. These formations occur after extended downtrends when two “bottoms” have been formed.
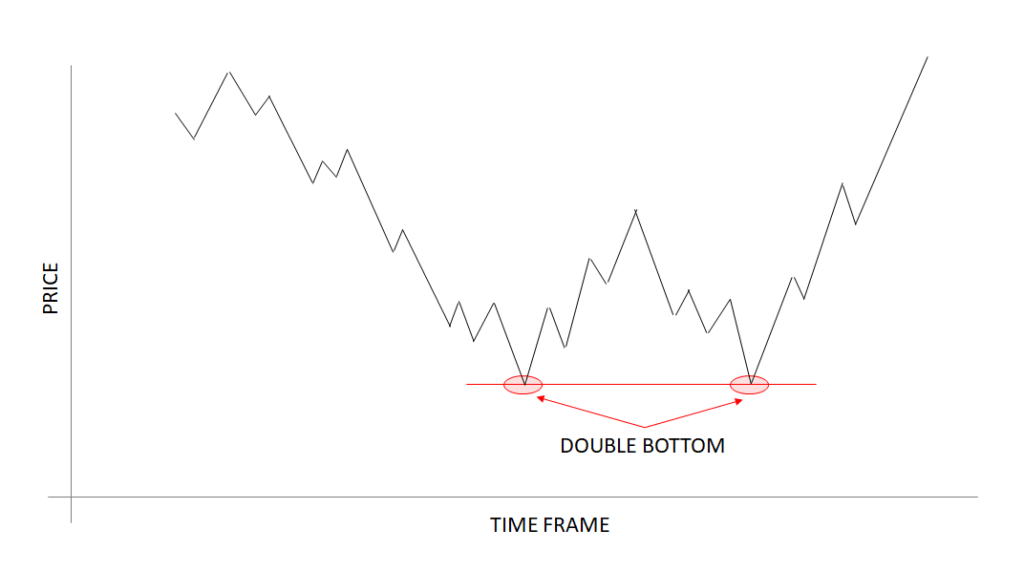
You can see from the chart above that after the previous downtrend, the price formed two bottoms because it wasn’t able to go below a certain level, indicating at this level strong support is formed.
Notice how the second bottom wasn’t able to significantly break the first bottom. This is a sign that the selling pressure is about finished and that a reversal is about to occur.
Important:
- Basing a double top or bottom solely on the formation of two consecutive peaks or bottoms could lead to a false reading and cause an early exit or entry of the position, leading to loss. Therefore, one must be extremely careful and patient.
- It’s better to use these chart patterns in conjunction with other indicators such as MACD or stochastic oscillators before jumping to conclusions.