BTC Trading: Elliott Wave Theory
Elliott Wave theory is a method of technical analysis that Bitcoin traders look for recurrent long-term Bitcoin (BTC) price patterns. The Elliott wave theory says that a crypto asset such as Bitcoin (BTC) price movements can be predicted as they move in repeating up-and-down patterns called waves created by investor psychology.
Note that Elliott wave or patterns do not provide any kind of certainty about Bitcoin (BTC) future price movement, but rather, serve in helping to find the probabilities for BTC future market action.
The theory identifies two different types of waves – impulse waves, and corrective waves.
Impulse wave:
Impulse waves consist of five sub-waves that make net Bitcoin (BTC) movement in the same direction. However, it has three rules that define its formation. These rules are unbreakable. If the pattern violates one of these rules, then the structure is not an impulse wave. The three rules are:
- Wave two cannot retrace more than 100 percent of wave one;
- Wave three can never be the shortest of waves one, three, and five.
Corrective waves:
In the Elliott wave model, the Corrective wave consists of three, or a combination of three, sub-waves that make net Bitcoin (BTC) movement in the direction opposite to the trend. Same as an impulse wave, each sub-wave of the diagonal never fully retraces the previous sub-wave, and sub-wave three of the diagonal may not be the shortest wave.
Simply put, movement in the direction of the trend is unfolding in 5 waves called Impulse wave. While any correction against the trend is in three waves known as the corrective wave.
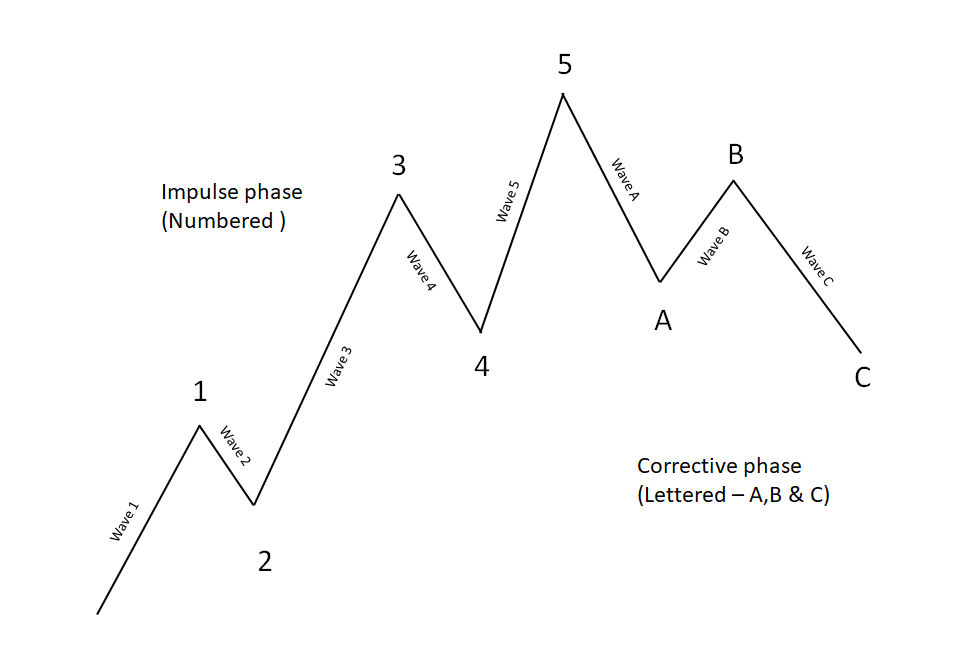
And the three-wave correction is labeled as a, b, and c.
The Elliott wave model suggests that an asset such as Bitcoin (BTC) market price can alternate between an impulse and a corrective phase on all time scales of the trend. These impulse and corrective waves are nested in a self-similar fractal to create larger patterns. Meaning, smaller patterns can be identified within bigger patterns.
These patterns can be seen in the long term as well as short term charts. For example, a one-year chart may be in the midst of a corrective wave, but a 30-day chart may show a developing impulse wave. A trader thus might have a long-term bearish outlook with a short-term bullish outlook.
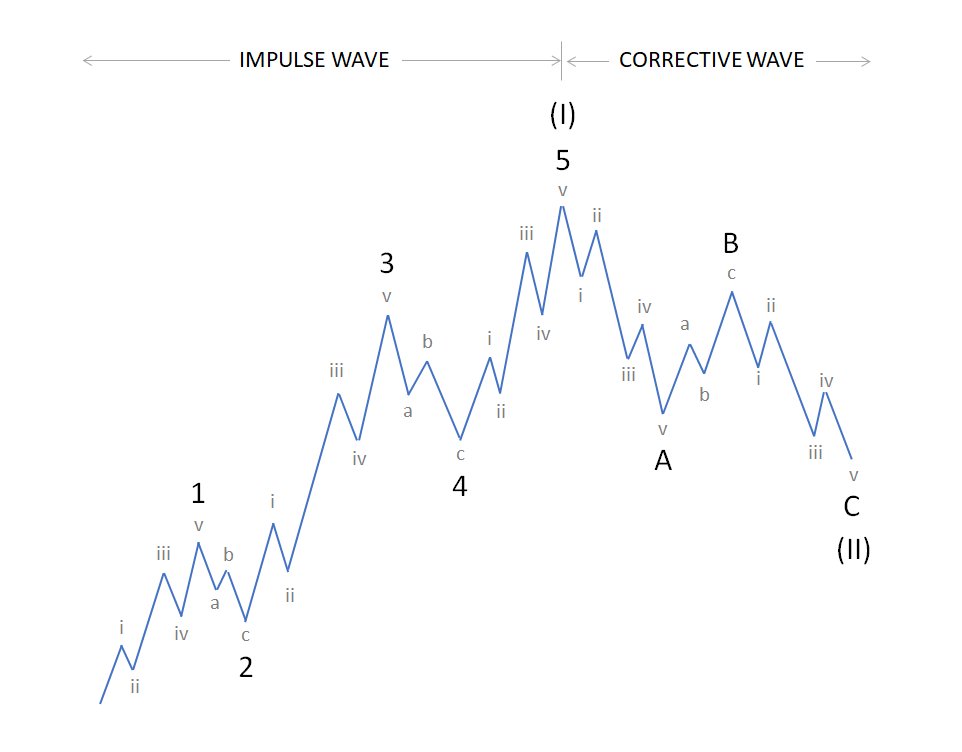
In the above image, wave 1, 3 and 5 are subdivided into 5 smaller degree impulses labelled as i, ii, iii, iv, and v. Wave 2 and 4 are corrective waves and they are subdivided into 3 smaller degree waves labelled as a, b, and c. The 5 waves move in waves 1, 2, 3, 4, and 5 make up a larger degree Impulse wave (I).
Corrective waves subdivide into 3 smaller-degree waves, denoted as ABC. Corrective waves start with a 5 wave counter-trend impulse (wave A), a retrace (wave B), and another impulse (wave C). The 3 waves A, B, and C make up a larger degree corrective wave (II).