BTC Price Horizon In Next One Month
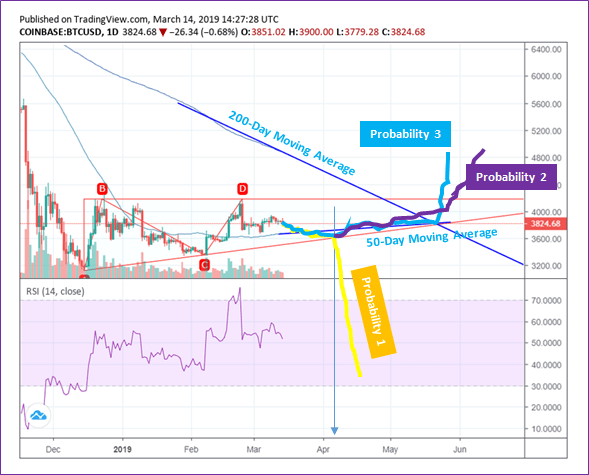
Since reaching its peak $4200 in Feb 2019, Bitcoin price continues to push downward. Currently, on the basis of the last 3 months pattern, we see a build-up of an ascending triangle with upper-trendline at $4200.
The following analysis lays down probabilities based on chart patterns, extrapolating data and accounting for future events which may influence the Bitcoin Price action in the following one month time period.
Probability 1: Most likely Bitcoin prices may reach near the 3500$ support level around April 1st Week.
A critical moment to define which way the prices may move – does it respects the support level and moves upward or breaks down from the lower trend-line. Much of this could be influenced by market sentiment and sentiments could be driven by news.
Around this time, SEC will announce its decision on the Bitcoin ETF. Many hope VanEck-Solidx Bitcoin ETF proposal has a higher chance of acceptance, a decision to be taken on 5th April. Given the long decision hold of VanEck-Solidx proposal, we may expect a final decision from the SEC.
A rejection may impact investors sentiment and result in massive sell pressure. The key support at $3000 may get retested. If the BTC price does not support at $3000, further losses may continue and most likely should drop to $1850 levels.
Alternatively, if SEC extends the Bitcoin ETF decision, we may see a slight impact. Therefore, if BTC price stays above the 3500-3600$ level, probability 3 could be a scenario.
Probability 2: Miners and investors see larger benefit to hold for long-term
Many believe that ‘Bitcoin halving’ could be an event that could save the day. An event which takes place every 4 years. Currently reward for each block is 12.5 BTC. After BTC halving event which takes place in May 2020, the reward will be reduced to 6.25 BTC.
As per the trends from the previous two bitcoin halving events, an uptrend begins approx one year prior (exact 13 months earlier) to the halving, an event which coincides on April 1st week period.
Knowing in advance that generating blocks in the Bitcoin network will be 2 times more expensive than now, psychology investors or miners may prefer to better hold their bitcoin for long-term driving supply shortcoming. This may lead to an upward movement breaking the resistance level at $4200 to reach new highs at $5500 and $6500.
Probability 3: Continues to maintain prices near $3600 – 3700. 50-day moving average crosses above 200.
Moving average study is one of the traders favorite indicator, especially when 50-day moving average crosses above 200-day moving average. This is considered largely a sign of a healthy market.
By extending the 50-day and 200-day moving averages, a cross-over may happen around the 3rd week of May. This might be possible if the BTC price is maintained above the $3600-$3700 levels. If this happens, we may see exponential growth in trading activity/volumes and price may drive upwards quickly.
NOTE: Extrapolating may not be the best approach but still considered in our study to have all probabilities.