Bitcoin Price Trend Analysis – Assuming It Follows Descending Triangle Pattern
Last week, the Bitcoin price bounced from $9,860$. Currently, the Bitcoin price trend is following the descending triangle pattern and nearing towards the climax of the triangle. A breakout either way will lead to a spike in volume.
As of now, the market is indecisive on which direction it will break. Typically, near the apex of the triangular pattern, traders look for an escalated trading volume before entering a new trade. Interestingly around the same period, the Bakkt will launch physically-delivered daily and monthly bitcoin futures contract on Sept 23.
Possible scenarios:
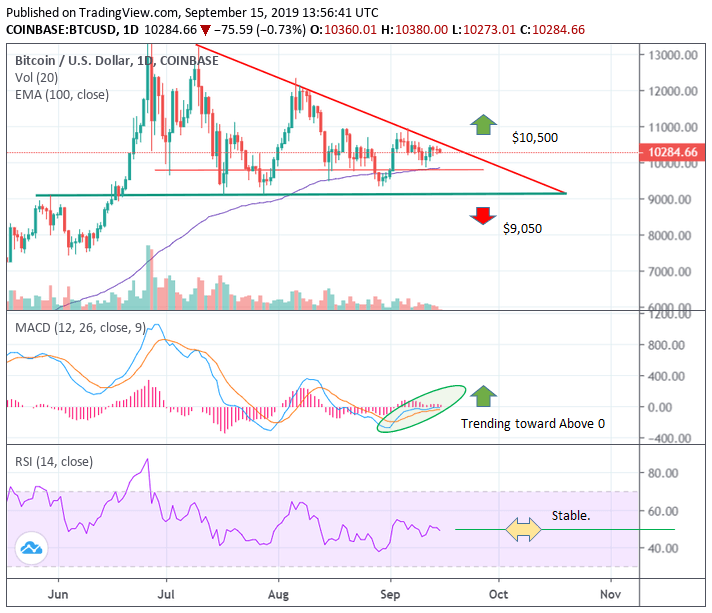
For bullish sentiment to continue, Bitcoin has to stay above support at $9,750 for the coming week. A breakout above the resistance zone of $10,500 is required. If the Bitcoin price trend manages to successfully break above the resistance zone and holds the zone as support, the BTC price can continue to move upwards and target new highs at $14,000.
Incase Bitcoin price can’t break above $10,500 and continues to produce lower highs, $9,050 could act as a support level. If the trend breakouts below the $9,050 support level and follows with escalated trading volume (high sell orders), the Bitcoin price may continue to drop towards the $7500 levels.
Technical Indicators:
- On the daily charts trends, the RSI of BTC/USD is currently stable, near 50.
- MACD indicates BTC/USD is trending slowing towards above zero levels, a positive indication.
- Interim support at $9,750, Major support at $9,050.
- Resistance at $10,500.
Check here the live Bitcoin price trends.